Top Plant-Based & Allergen-Free Foods Highest in Total Fat (USDA Ranking)
Allergen-free and plant-forward whole foods rich in Total Fat (g per 100g), verified against the Wise Eating USDA Standard Reference catalog. Concentrated energy source required for steroid hormone synthesis, cell membranes, and fat-soluble vitamin absorption.
USDA Leaderboard: Top Plant-Based & Allergen-Free Foods Highest in Total Fat (USDA Ranking)
Click any food below to open its full 100+ nutrient profile (including 22 vitamins, 11 minerals, amino acids, omega-3s, PRAL acid load, and WHO baby feeding age). Top food in this category: Fat back, cooked (81.9 g per 100g).
| Rank | USDA Food Item | Total Fat / 100g | % Daily Value | Per 100 kcal | Calories & Protein |
|---|---|---|---|---|---|
| #1 | 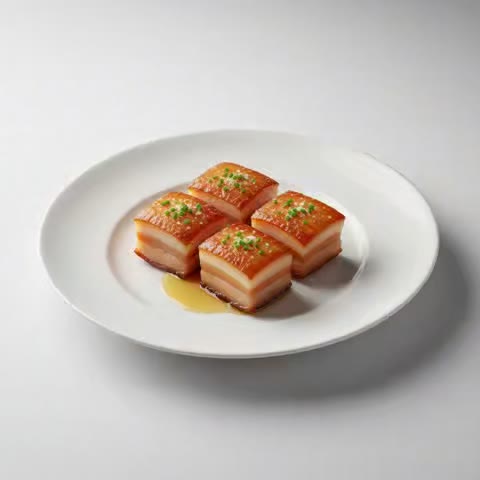 Fat back, cooked | 81.9 g | 100% | 10.9 g | 750 kcal · 2.68g P |
| #2 | 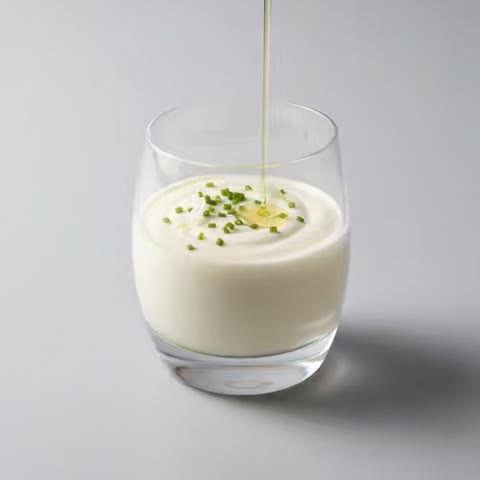 Garlic sauce | 74 g | 94.9% | 10.8 g | 683 kcal · 1.43g P |
| #3 | 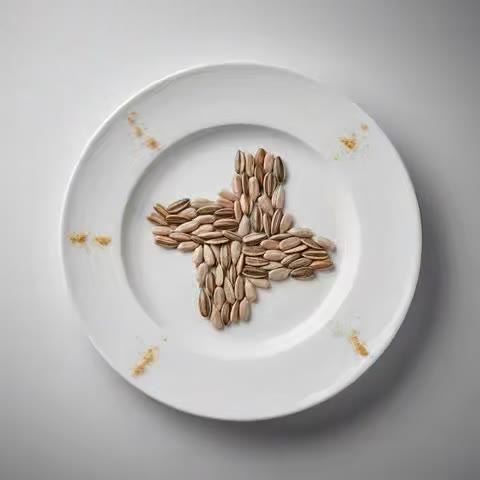 Sunflower seeds, plain, unsalted | 49.8 g | 63.8% | 8.56 g | 582 kcal · 19.3g P |
| #4 | 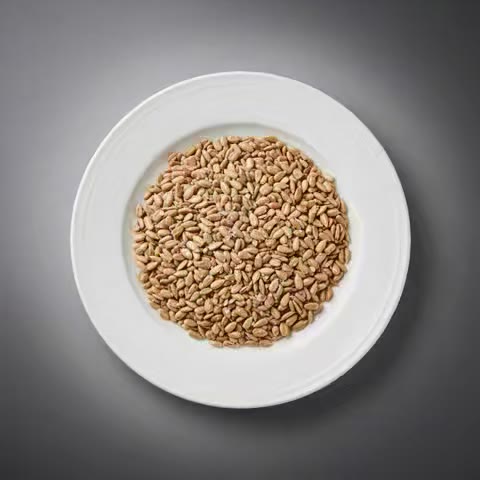 Sunflower seeds, plain, salted | 49.2 g | 63.1% | 8.56 g | 575 kcal · 19.1g P |
| #5 | 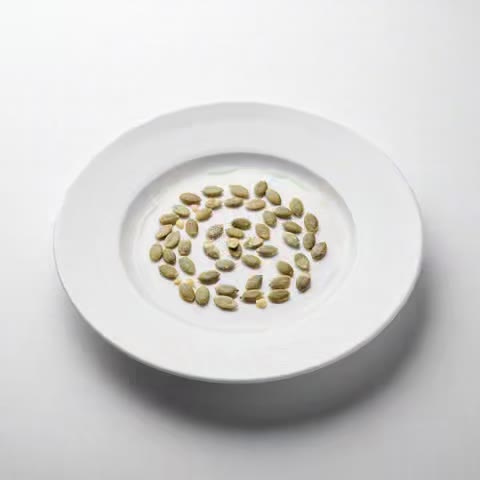 Pumpkin seeds, unsalted | 49 g | 62.9% | 8.55 g | 574 kcal · 29.8g P |
| #6 | 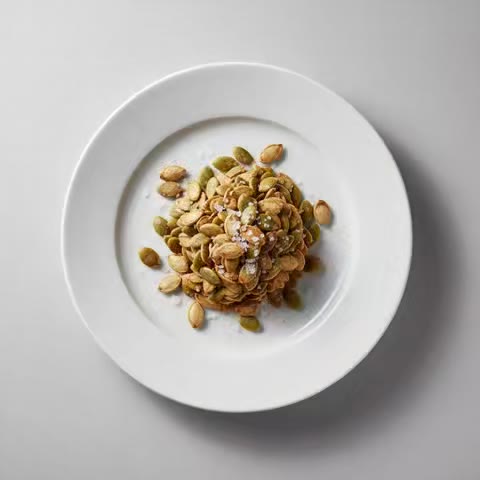 Pumpkin seeds, salted | 48.5 g | 62.1% | 8.55 g | 567 kcal · 29.5g P |
| #7 | 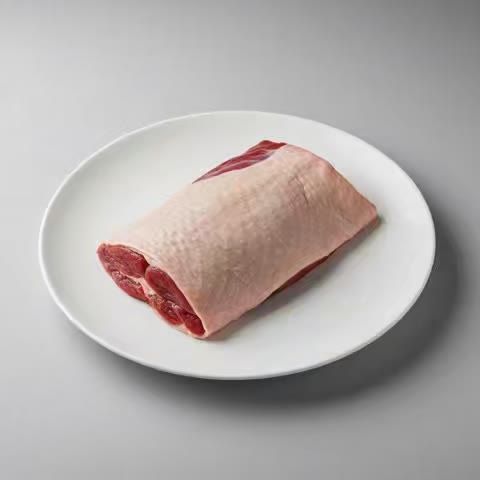 Duck, domesticated, meat and skin, raw | 39.3 g | 50.4% | 9.74 g | 404 kcal · 11.5g P |
| #8 | 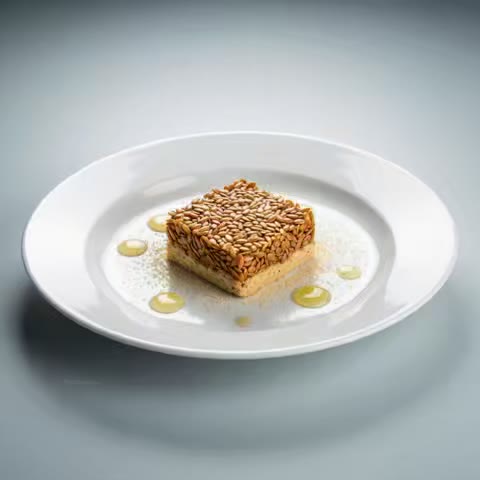 Flax seeds | 37.3 g | 47.8% | 6.84 g | 545 kcal · 18g P |
| #9 |  Snacks, potato chips, lightly salted | 35.4 g | 45.4% | 6.32 g | 560 kcal · 6.72g P |
| #10 | 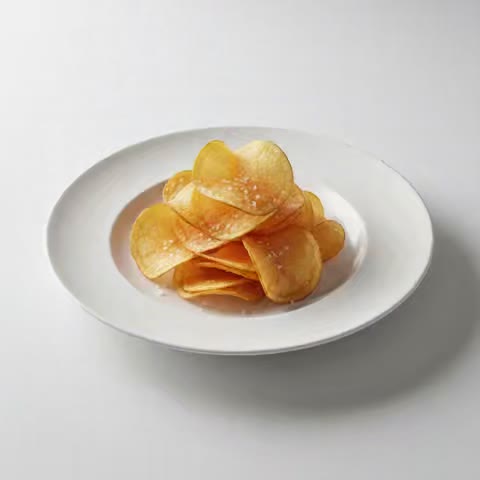 Potato chips, lightly salted | 35.3 g | 45.3% | 6.32 g | 559 kcal · 6.71g P |
| #11 | 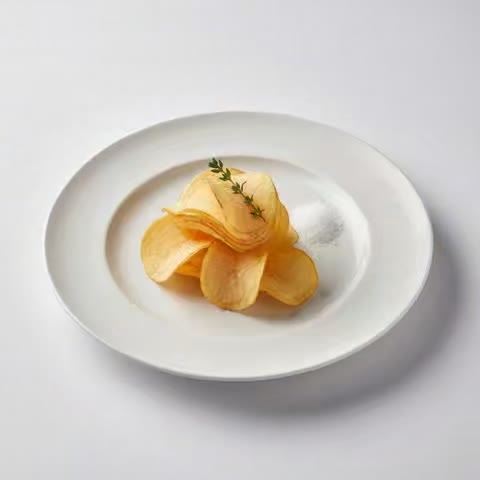 Potato chips, plain | 34 g | 43.6% | 6.39 g | 532 kcal · 6.39g P |
| #12 | 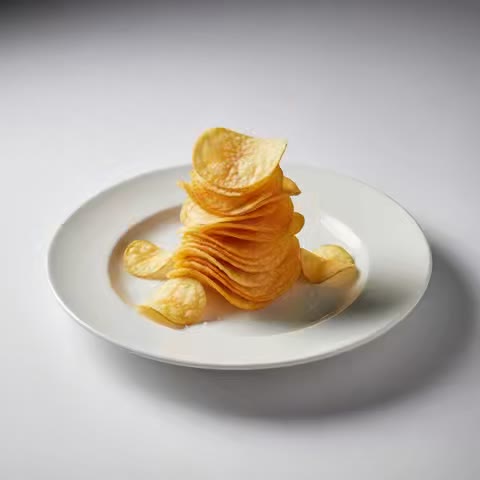 Potato chips, ruffled, plain | 34 g | 43.6% | 6.39 g | 532 kcal · 6.39g P |
| #13 | 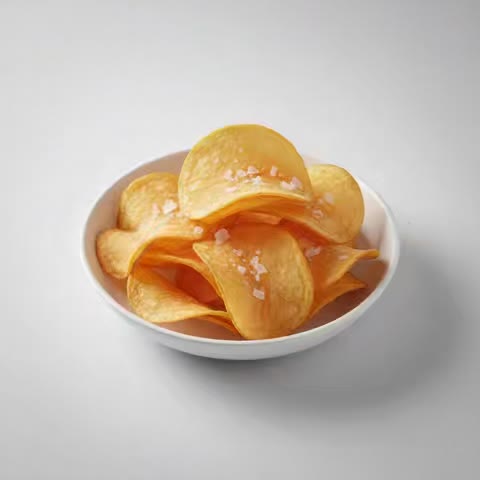 Snacks, potato chips, plain, salted | 34 g | 43.6% | 6.39 g | 532 kcal · 6.39g P |
| #14 | 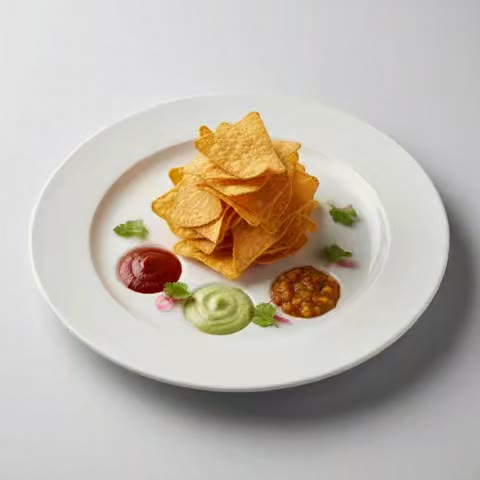 Corn chips, reduced sodium | 33.6 g | 43.1% | 6.13 g | 549 kcal · 6.84g P |
| #15 | 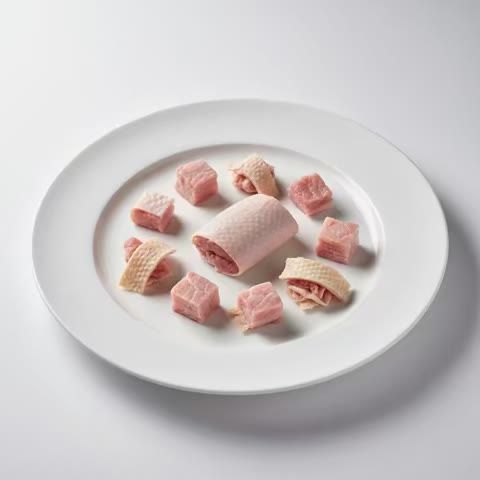 Goose, domesticated, meat and skin, raw | 33.6 g | 43.1% | 9.06 g | 371 kcal · 15.9g P |
| #16 | 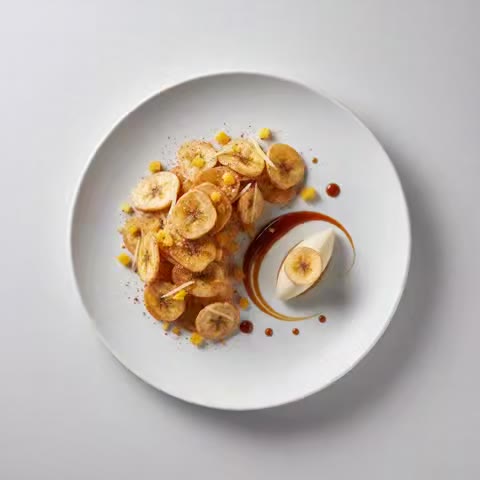 Banana chips | 33.6 g | 43.1% | 6.47 g | 519 kcal · 2.3g P |
| #17 | 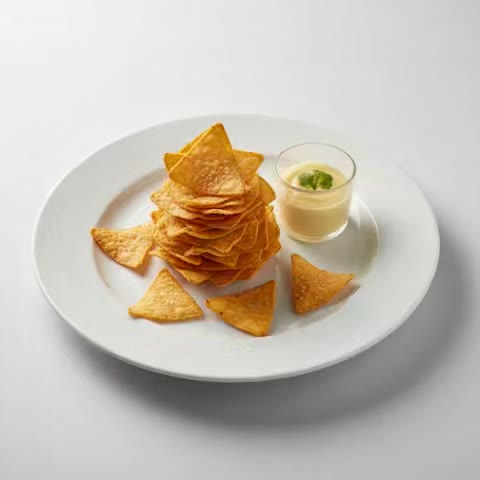 Corn chips, plain | 33.1 g | 42.4% | 6.19 g | 535 kcal · 6.12g P |
| #18 |  Snacks, sweet potato chips, unsalted | 32.4 g | 41.5% | 6.08 g | 532 kcal · 2.94g P |
| #19 |  Potato chips, barbecue flavored | 31.1 g | 39.8% | 6.38 g | 487 kcal · 6.51g P |
| #20 | 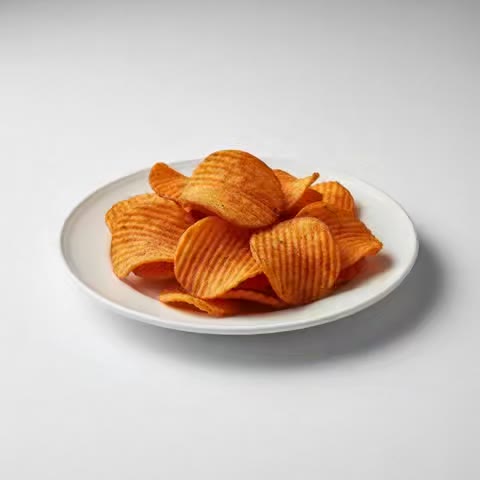 Snacks, potato chips, barbecue-flavor | 31.1 g | 39.8% | 6.38 g | 487 kcal · 6.51g P |
| #21 | 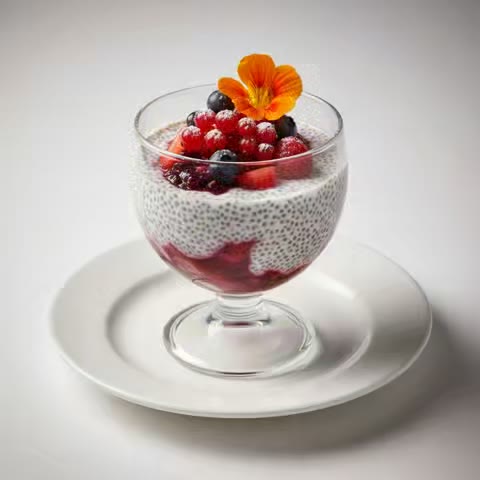 Chia seeds | 30.7 g | 39.4% | 6.33 g | 486 kcal · 16.5g P |
| #22 | 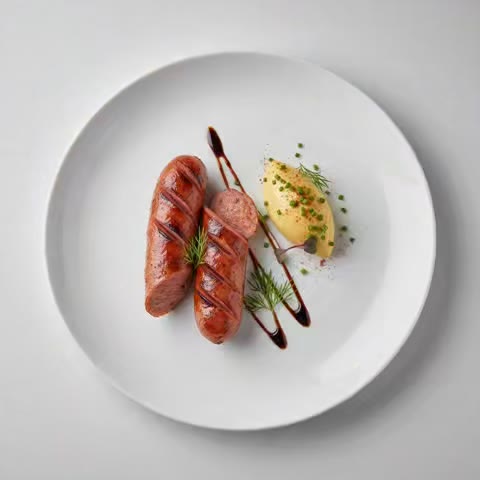 Kielbasa, fully cooked, grilled | 29.7 g | 38.1% | 8.81 g | 337 kcal · 12.4g P |
| #23 | 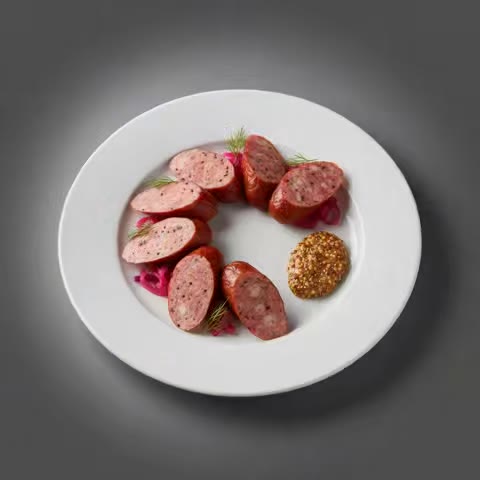 Kielbasa, fully cooked, unheated | 29.6 g | 38% | 9.12 g | 325 kcal · 10.8g P |
| #24 | 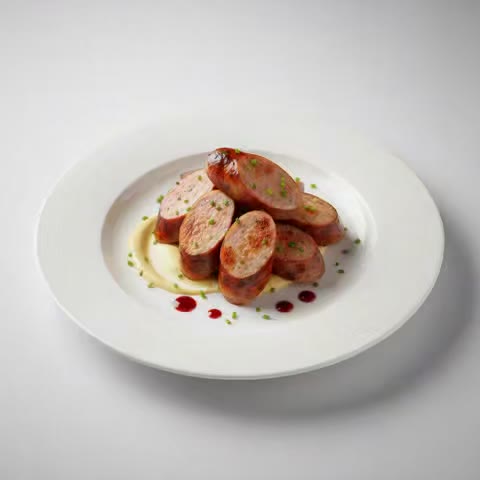 Kielbasa, fully cooked, pan-fried | 29.4 g | 37.7% | 8.84 g | 333 kcal · 12.4g P |
| #25 |  Duck, cooked, skin eaten | 28.2 g | 36.2% | 8.4 g | 336 kcal · 18.9g P |
| #26 |  Duck, roasted, skin eaten | 28.2 g | 36.2% | 8.4 g | 336 kcal · 18.9g P |
| #27 | 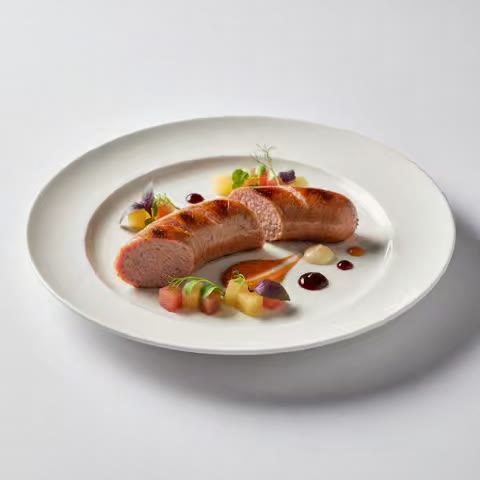 Frankfurter, meat and poultry, cooked, grilled | 26.4 g | 33.9% | 8.75 g | 302 kcal · 10.7g P |
| #28 | 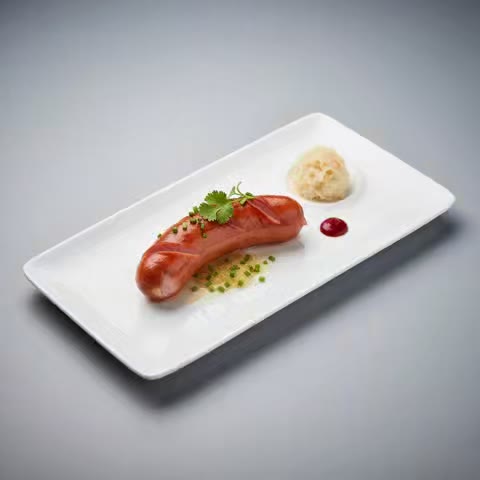 Frankfurter, meat and poultry, cooked, boiled | 26.3 g | 33.7% | 8.82 g | 298 kcal · 10.3g P |
| #29 |  Squab, (pigeon), meat and skin, raw | 23.8 g | 30.5% | 8.1 g | 294 kcal · 18.5g P |
| #30 | 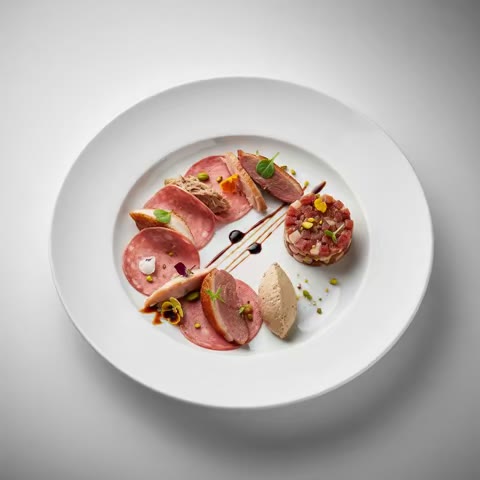 Bologna, meat and poultry | 23.8 g | 30.5% | 8.46 g | 281 kcal · 10.3g P |
| #31 |  Tostada shells, corn | 23.4 g | 30% | 4.93 g | 474 kcal · 6.15g P |
| #32 |  Goose, wild, roasted | 21.8 g | 28% | 7.18 g | 304 kcal · 25.1g P |
| #33 |  Taco shell, corn | 21.8 g | 27.9% | 4.58 g | 476 kcal · 6.41g P |
| #34 | 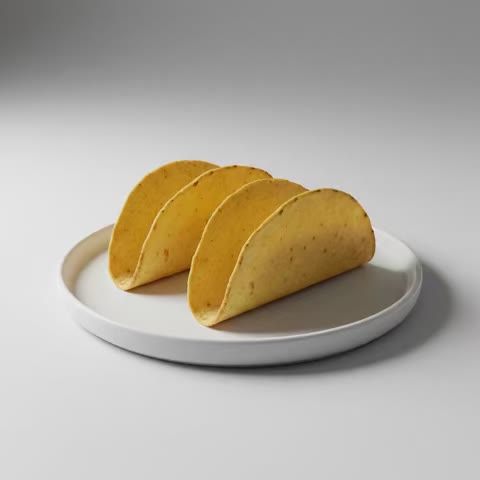 Taco shells, baked | 21.8 g | 27.9% | 4.58 g | 476 kcal · 6.41g P |
| #35 |  Rice bran, crude | 20.9 g | 26.7% | 6.6 g | 316 kcal · 13.3g P |
Related Nutrient & Macro Rankings
Frequently Asked Questions
In our verified USDA ranking (Top Plant-Based & Allergen-Free Foods Highest in Total Fat (USDA Ranking)), Fat back, cooked ranks #1 with 81.9 g of Total Fat per 100g serving (105% of the 78 g Daily Value).
The reference adult Daily Value for Total Fat is 78 g. Concentrated energy source required for steroid hormone synthesis, cell membranes, and fat-soluble vitamin absorption.
Wise Eating: AI Food Tracker (id6751406823) tracks Total Fat (g) across 12,000+ USDA foods and highlights which pantry items or recipes will close your daily nutrient gap.